Since 21st April 2015, Google ranks mobile friendly websites higher than their desktop counterparts in search results from mobile devices.
Websites that are not deemed to be easily usable on mobile devices will effectively be penalised.
The thing to bear in mind is that it refers to website rankings delivered by mobile phone searches.
Google Analytics provides a mobile vs desktop traffic breakdown
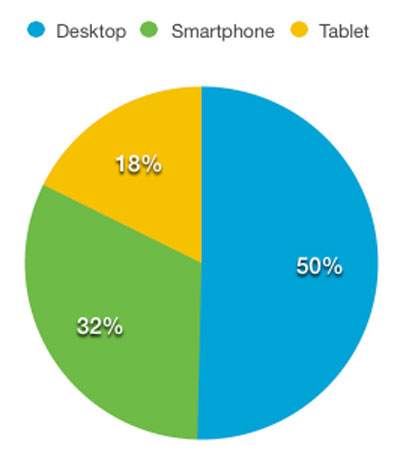
To gauge how it might impact on your website, you can determine what percentage of traffic comes from desktops and what percentage comes from tablets and mobile phones via Google Analytics.
Google Analytics provides a straight breakdown of visits by Desktop (including Laptops), Mobile phones and Tablets.
Statistics that we have drawn from a broad base of B2B and B2C websites that we host and maintain show that traffic generated by mobile devices (tablet and smartphones) ranges from between 12% and 50%.
The BBC has just announced that 65% of the traffic coming to their website is from mobile devices.
The trend of mobile traffic is up slowly but surely rising and within that mobile friendly category the smartphone share of the mobile traffic is outstripping that of the tablet.
How might your website be affected already by the rise in smartphone usage?
We looked at a “NON MOBILE FRIENDLY” website and did a few calculations based on the Bounce rate.
What is the Bounce rate:
The bounce rate is the number of instances where somebody visits a website but leaves from the same page they arrived on with out interacting with any other pages or links.
So, a few reasons why website visitors may bounce:
- They landed on the website got the relevant information i.e. a telephone number and left satisfied.
- The landing page or the link to the viewed page on the website contained the relevant news article of interest.
- Poor content and few or no calls to action (CTA's)
- They came to the website by accident and left.
- They came to the website and it took too long to load.
- They came and it did not “suit them” i.e.
- product
- service
- perceived quality
- location
- look and feel.
- There was a broken link.
- They landed on the website using a mobile phone and couldn’t navigate around on it without resizing and scrolling and the form was just hell to fill in....
So here are the stats generated by Google Analytics of a "non mobile friendly" website taken over the course of a 30 day period which had 4228 visits.
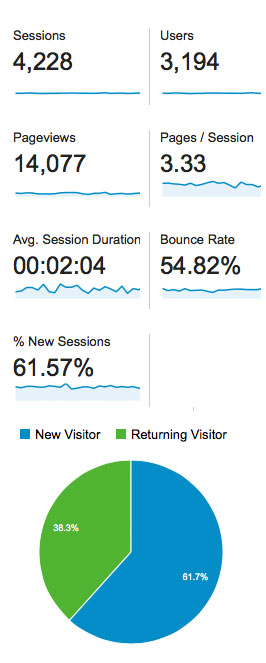
The bounce rate was 54.82% which means that less than half actually clicked further into the website from the landing page.
2318 left whichever page that they landed on without clicking anywhere else on the website.
.jpg)
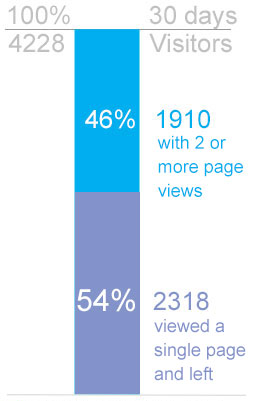
So why did 54% of site visitors to this website leave with only one page view?
Isn’t a 54% bounce rate just awful?
Perhaps this is one of the burning question that comes out of this.
Well we think it is awful relevant to the fact that we know how to tackle it and an easily achievable goal of reducing the rate by 10% plus, but an extract from a “hibu” report on one of their websites forwarded to me by a client late last year says:
“We like this (the bounce rate) to be below 80 % and since our sites are lead generators this metric doesn’t matter too much. Often a customer will look at your site and then call you straight away.”
I suspect that this maybe regarded by some as OK and more pertinent to websites offering certain products and services, but in any language an 80% bounce rate is undesirable and indicative of a need to thoroughly review the website.
In this instance the website has a 54% bounce rate and an easily achievable goal of reducing the rate by 10% plus in the first instance.
The chart above showing that 50% of traffic on this website comes from mobile devices.
Bounce Rate Breakdown by Desktop, Smartphone and tablet:
Overall the bounce rate is 54% of all traffic, however the impact of the "non Mobile Friendly ' or "Unresponsive " website is bought into stark focus when viewing the bounce rate of the individual Device categories.
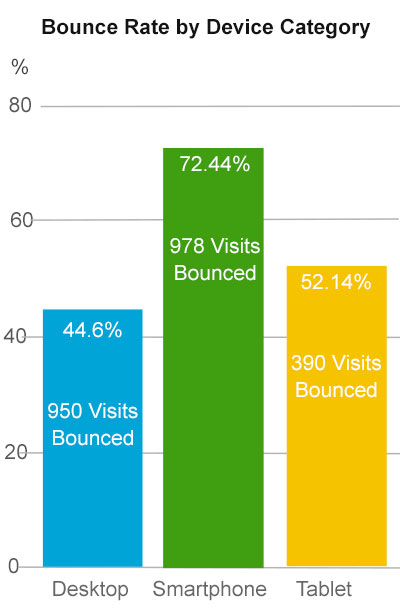
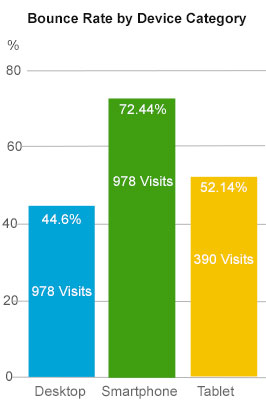
The chart above shows that the number and % of bounces per device category.
- Smartphone accounts for the highest bounce rate with 978 bounces (72%) out of 1350 visits
- The Tablet is in second place with 390 bounces (52%) out of 748 visits
- The desktop has the lowest bounce rate with 950 bounces (44%) out of 2130 visits
28% higher Bounce rate on Mobile Phones compared to Desktops
So the bounce rate for this Non mobile friendly website had a device variation of almost 28% - Desktop vs Smartphone.
The bigger the screen size the lower the bounce rate.
What sort of mobile devices are accessing the website?
There were 166 different models of tablet and smartphone that accessed the website ranging from the Tesco Hudll 2, the Blackberry Z10 a variety of Samsung's , Motorola’s and Nokia’s.
The top two mobile devices incidentally was the Apple iPhone in first place with 750 visits followed by the Apple iPad with 577 out of a total of 2098 visits.
One of the statistics that Google Analytics gives is the “average” number of page views per visit.
If you are fading away at this point, I can understand, but out of the stats does come a glimmer of light.
The “Page Views” average per visit actually rises:
The 2,318 people who “bounced” contributed to the “average” page views per visit of 3.33.
But each bounced visit could only have an average page view of 1.
So, if you take each of the bounced 2318 visits which Google Analytics has allocated 3.33 page views and reduce that avarage by 1 , it means that we have 2318 x 2.33 page views to be redistributed amongst the 1910 visitors who progressed further into the website.
This takes the average number of pages viewed of the remaining 1910 visits from 3.33 to 6.15 pages with a minimum page view of 2.
Well done if you have not (completely) zoned out by now.
When you start defining these sort of figures relative to multi product ecommerce websites, it makes a huge difference to how you view and interpret the figures generated before taking action in respect of changes to content placement, calls to action and tweaking in general whether it be A/B page comparisons (Trying out and monitoring the effect of different page layouts) or even price discounting.
Traffic Overview
The website had 3194 visitors generating 4228 visits
Brand New Traffic
The total number of New Visitors to the website were 2607 - How exciting is that!
(interpret visitors as devices, so if you visit the same website using your laptop, mobile phone and tablet it would count as 3 different visitors and on the first visit from each device in any measured period count as a new visitor)
Returning visitors contributed 1621 visits
Mobile Visitor Numbers:
Out of the 1350 smartphone and 748 tablet users 867 (64%) and 388 (51%) respectively were visiting the website for the first time.
Conclusions:
In this instance almost 50% of traffic is coming from Mobile Devices with a 64 / 35% split in favour of smartphones / tablets and making heavy weather of the website.
The new google algorithm will down grade this site relevant to all Google searches on mobile devices so that there will be less organic search traffic.
If you take into account the the significant variance in bounce rate by device category, the most ardent luddite would concede that mobile phone users are quick to go elsewhere if the website is not mobile friendly, but also that at 50% a massive amount of people are using using mobile phones as their primary device to browse websites.
If the bounce rate of the smart phone and the tablet were reduced JUST to the same as that of the desktop it would mean a monthly increase of 432 visits of 2 or more page views.
The additional breakdown of devices gives us more information in how users browse the website and in this particular instance demonstrated that if your content has sufficient appeal then even mobile phone users will persevere if the content or product is right for them.
This very small overview relates how important analysing your website activity is.
The number of new visitors (as opposed to visits) to the website in the 30 day period was 61%.
The exciting project (in hand) is to make the website mobile friendly, focussing on reducing the bounce rate regardless of device and realising the significant potential by analysing the traffic flow and behaviour and managing the content and calls to action to increasing the conversion rate.
Now That Is Exciting!